
Olo Investor Presentation Microsite
The Olo Investor Presentation is showcased as an interactive microsite, offering insights into the company's forward-looking strategies, financial insights, and industry influence within the technology sector.
First Quarter 2022 Presentation May 10, 2022

2022 Olo Inc. All rights reserved. 2 Safe Harbor Disclosure The material in this presentation (this Presentation) regarding Olo Inc. (we, us or the Company) is for informational pu rposes only. This Presentation contains statements that constitute forward - looking statements. All statements other than stateme nts of historical fact are forward - looking statements and may be recognized by the use of words such as expects, plans, will, may, estimates, projects, intends, or words of similar meaning. These statements include, but are not limited to, our financial guidance for the second quarter of 2022 and the full year 2022; our total addressable market; our growth and market op portunities in both the near - and long - term, including estimates related to (i) the adoption of our products by additional enterprise brands, (ii) additional orders per location due to a transition towards digital entirety, (iii) additional revenue pe r order due to the adoption of Olo Pay, and (iv) small - to - medium business and global expansion; statements regarding the ongoing importance of digital experiences to the restaurant industry; our business strategy; our ability to sustain our profitability ; c ustomer adoption of our products and expectations for capturing market share and our delivery of new products or product feat ure s; customers spending decisions and ordering behavior particularly as COVID - 19 associated restrictions abate. Accordingly, actual results could differ materially or such uncertainties could cause adverse effects on our results. Such forward - looking statements are not guarantees of future performance and involve risks and uncertainties, and actual results may differ from t hos e in the forward - looking statements as a result of various factors and assumptions. Forward - looking statements are based upon various estimates and assumptions, as well as information known to us as of the date o f this Presentation, and are subject to risks and uncertainties, including but not limited to: the impact and duration of the ongoing COVID - 19 pandemic on our business, including any shift in consumer preferences as government measures in the United Stat es have largely been lifted; the business of our customers and, economic conditions, including rising inflation, labor shortages and increasing interest rates; our focus on the long - term and our investments in sustainable, profitable growth; our a bility to develop and release new products and services, and develop and release successful enhancements, features, and modifications to our existing products and services; the impact of new and existing laws and regulations on our business; cha nge s to our strategic relationships with third parties; our reliance on a limited number of delivery service providers and aggregators; our ability to generate revenue from our product offerings and the effects of fluctuations in our level of clien t s pend retention; competition; changes in the amount and mix of transactions facilitated through our platform; changes in our l eve l of investment in sales and marketing, research and development, and general and administrative expenses, and our hiring plans; f utu re changes to our pricing model; changes in management; and other general market, political, economic, and business conditions. Additional risks and uncertainties that could affect our financial results and forward looking statements are inc lud ed under the caption Risk Factors in our Annual Report on Form 10 - K for the year ended December 31, 2021, and our other SEC filings, which are available on the Investor Relations page of our website at investors.olo.com and on the SEC website at www .se c.gov. Undue reliance should not be placed on the forward - looking statements in this Presentation. All forward - looking statements contained herein are based on information available to us as of the date hereof, and we do not assume any obligati on to update these statements as a result of new information or future events. In addition to our financial statements, which are prepared in accordance with generally accepted accounting principles in th e U nited States (GAAP), this Presentation presents non - GAAP gross profit/margin (and as a percentage of revenue), non - GAAP operating expenses (total and each line item, and total and each non - GAAP operating expense item as a percentage of revenue) and non - GAAP operating income (and as a percentage of revenue). Our use of non - GAAP financial measures has limitations as an analytical tool, and these measures should not be considered in isolation or as a substitute for analysis of GAAP financia l r esults. We use non - GAAP financial measures in conjunction with GAAP financial measures for planning purposes, including in the preparation of our annual operating budget, as a measure of our core operating results and the effectiveness of our business str ategy, and in evaluating our financial performance. These measures provide consistency and comparability with past financial performance, facilitate period - to - period comparisons of core operating results, and also facilitate comparisons with other peer companies, many of which use similar non - GAAP financial measures to supplement their GAAP results. Investors are cautioned that there are material limitations associated with the use of non - GAAP financial measures as an analytical tool. In particular, (1) stock - based compensation expense has recently been, and will continue to be for the foreseeable future, a significant recur ring expense for our business and an important part of our compensation strategy and (2) although amortization expense is a non - cash charge, the assets subject to amortization may have to be replaced in the future. The non - GAAP measures we use may be different from non - GAAP financial measures used by other companies, limiting their usefulness for comparison purposes. Such non - GAAP financial measures should be considered as a supplement to, and not as a substitute for, or superior to, the corresponding measures calculated in accordance with GAAP. We compensate for these limitations by providing specific informat ion regarding the GAAP items excluded from these non - GAAP financial measures. A reconciliation of these non - GAAP measures has been provided in the financial statement tables included in the appendix to this Presentation and investors are enc ouraged to review the reconciliation. Certain information contained in this Presentation relates to or is based on studies, publications, surveys, and other data o bta ined from third - party sources and our own internal estimates and research. While we believe these third - party sources to be reliable as of the date of this Presentation, we have not independently verified and makes no representation as to the adequa cy, fairness, accuracy, or completeness of any information obtained from third - party sources. In addition, all of the market data included in this Presentation involves a number of assumptions and limitations, and there can be no guarantee as to the accur acy or reliability of such assumptions. Finally, while we believe our own internal research is reliable, such research has not be en verified by any independent source.
2022 Olo Inc. All rights reserved. 3 Leading open SaaS platform for restaurants
2022 Olo Inc. All rights reserved. 4 Olo At - a - Glance As of 3/31/2022. Restaurants represent Active Locations as of 3/31/2022, ARPU represents First Quarter 2022 metric, GMV represents Gross Merch and ise Value for Full Year 2021. Please see the explanation of Non - GAAP Financial Measures in the appendix for additional information. BRANDS 600+ ARPU $516 RESTAURANTS 82,000 GMV $20B + PARTNERS 300+ ORDERS/ DAY 2M+

2022 Olo Inc. All rights reserved. 5 Its not an on - premise business and an off - premise business anymore. Its one business. Dave Harris, CIO Shake Shack Represents number of annual transactions by type in 2021. Source: NPD Restaurant Industry Data for Full Year ended 12/31/2021. Olo Enables Every Type of Restaurant Order OFF - PREMISE 45B ON - PREMISE 12B
2022 Olo Inc. All rights reserved. 6 Only 15% of restaurant orders are digital Source: NPD, Full Year Ended 12/31/2021.
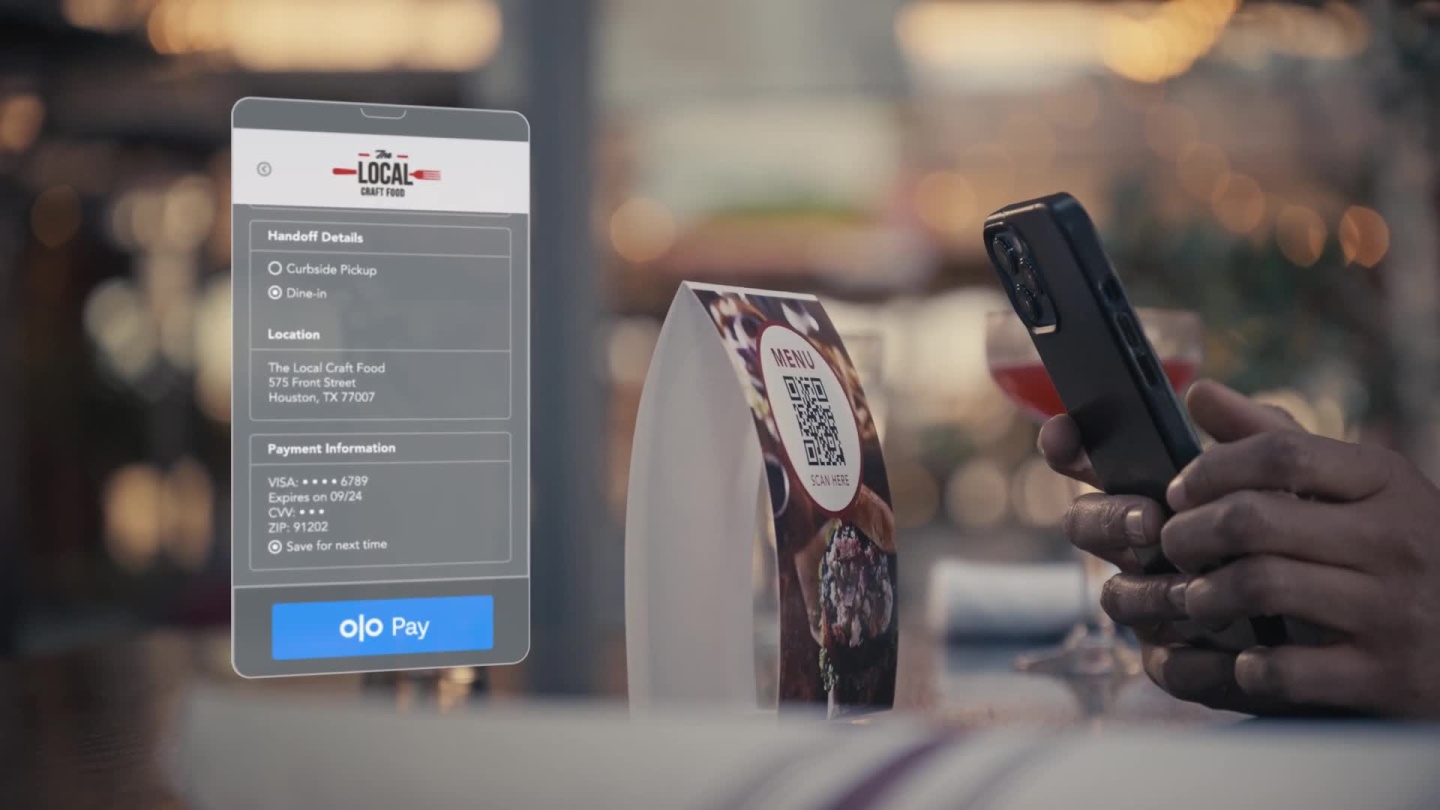
2022 Olo Inc. All rights reserved. 7 Solutions for Every Consumer Touchpoint Engagement Payment Drive - Thru Delivery Take - Out Dine - In Reservations and Waitlist
This is a modal window.
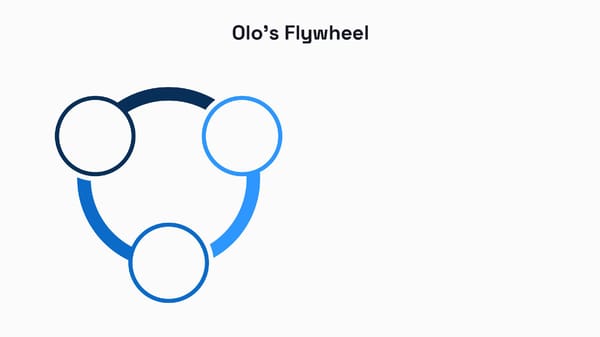
2022 Olo Inc. All rights reserved. 8 Olos Flywheel 300 + Partners 600 + Brands 85 Million Guests Metrics as of 3/31/2022. Guests represents unique users who have ordered over the platform from 1 2/31/2020 to 12/31/2021.
2022 Olo Inc. All rights reserved. 9 One - to - Many Go - to - Market Strategy Unique Mix of High Revenue Growth and Profitability Long - Term Exclusivity Across All Locations Brand Relationship Highly Efficient GTM Strategy
2022 Olo Inc. All rights reserved. 10 Near - Term Growth Vectors Olos 100x US Enterprise Opportunity Note: Illustrative purposes only. Company estimates. Olo Pay estimates use gross revenue recognition. Digital Entirety represents the Olo Platform processing 100% of all restaurant industry orders, in part due to anticipated gr owt h in multi - product adoption. Digital Entirety 6.25x MORE ORDERS/ LOCATION Olo Pay 4x MORE REVENUE/ORDER Restaurants 4x MORE LOCATIONS
2022 Olo Inc. All rights reserved. 11 The Numbers First Quarter 2022 Highlights
2022 Olo Inc. All rights reserved. 12 First Quarter 2022 Highlights Metrics represent First Quarter ended 3/31/2022 numbers. *Operating Margin is a non - GAAP financial measure. Please see the explanation of non - GAAP Financial Measures as well as the non - GAAP reconciliation in the appendix. Y/Y REVENUE GROWTH 18% OPERATING MARGIN* 4% ACTIVE LOCATIONS 82,000 ARPU $516

2022 Olo Inc. All rights reserved. 13 69,000 82,000 Q1 2021 Q1 2022 35,000 42,000 +20% 64,000 +52% 79,000 +23% 2018 2019 2020 2021 Active Locations Enterprise - Focused, Scaled Vertical Leader 19% 31% Compound Annual Growth Rate As of 3/31/2022. Please see the explanation of non - GAAP financial measures in the appendix for information related to active locations. Active Locations Active Locations
2022 Olo Inc. All rights reserved. 14 $525 $516 Q1 2021 Q1 2022 Average Revenue per Unit (ARPU) 1.5% 800m 16% 9.3 billion Increasing Digital Orders and Multi - Product Adoption Fuel Long - Term ARPU Growth As of 3/31/2022. Please see the explanation of non - GAAP financial measures in the appendix for information related to ARPU. $935 $1,160 +24% $1,740 +50% $2,019 +16% 2018 2019 2020 2021 29% Compound Annual Growth Rate ARPU ARPU
2022 Olo Inc. All rights reserved. 15 $36.1 $42.8 Q1 2021 Q1 2022 2018 2019 2020 2021 Strong Revenue Growth 1.5% 800m 84% 49.2 billion 16% 9.3 billion When Our Customers Succeed, We Succeed $50.7 +59% $98.4 +94% $149.4 +52% $31.8 As of 3/31/2022. In millions, except percentages. 67% Compound Annual Growth Rate 18% Revenue Revenue
2022 Olo Inc. All rights reserved. 16 $30.0 $32.4 Q1 2021 Q1 2022 Continued Gross Profit Growth As of 3/31/2022. In millions except percentages. *Gross Profit is a non - GAAP financial measure. Please see the explanation of non - GAAP measures as well as the non - GAAP reconcili ation in the appendix. Transactional SaaS Model Yields Strong Gross Profit* $21.4 $35.5 +66% $80.8 +127% $122.4 +52% 2018 2019 2020 2021 79% Compound Annual Growth Rate 8% Gross Profit* Gross Profit*
2022 Olo Inc. All rights reserved. 17 26% 28% 30% 30% 10% 14% Q1 2021 Q1 2022 20% 17% 20% 26% 49% 41% 32% 32% 12% 12% 8% 10% 2018 2019 2020 2021 82% Attractive Operating Model 70% 60% 68% 66% 72% As of 3/31/2022. Chart depicts operating leverage, which is measured using adjusted operating expenses for the sum of R&D, S&M and G&A as a pe rce ntage of revenue. *Certain figures are non - GAAP financial measures. Please see the explanation of non - GAAP measures as well as the non - GAAP reconc iliation in the appendix. Efficient Revenue Acquisition Enables Scalable Operating Leverage* G&A R&D S&M

2022 Olo Inc. All rights reserved. 18 Capital - Efficient Operating Model As of 3/31/2022. In millions, except percentages. * Operating Income represents a non - GAAP financial measure. Please see the explanation of non - GAAP measures as well as the non - GAAP reconciliation in the append ix. Unique Mix of High Revenue Growth and Profitability $(4.6) $(0.2) $21.8 $21.3 2018 2019 2020 2021 Operating Income* Operating Income* $6.0 $1.7 Q1 2021 Q1 2022
