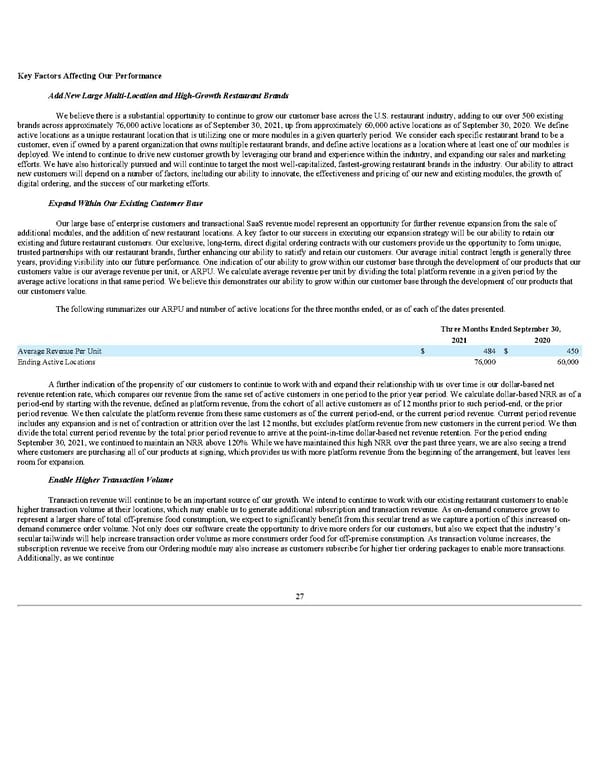
Key Factors Affecting Our Performance Add New Large Multi-Location and High-Growth Restaurant Brands We believe there is a substantial opportunity to continue to grow our customer base across the U.S. restaurant industry, adding to our over 500 existing brands across approximately 76,000 active locations as of September 30, 2021, up from approximately 60,000 active locations as of September 30, 2020. We define active locations as a unique restaurant location that is utilizing one or more modules in a given quarterly period. We consider each specific restaurant brand to be a customer, even if owned by a parent organization that owns multiple restaurant brands, and define active locations as a location where at least one of our modules is deployed. We intend to continue to drive new customer growth by leveraging our brand and experience within the industry, and expanding our sales and marketing efforts. We have also historically pursued and will continue to target the most well-capitalized, fastest-growing restaurant brands in the industry. Our ability to attract new customers will depend on a number of factors, including our ability to innovate, the effectiveness and pricing of our new and existing modules, the growth of digital ordering, and the success of our marketing efforts. Expand Within Our Existing Customer Base Our large base of enterprise customers and transactional SaaS revenue model represent an opportunity for further revenue expansion from the sale of additional modules, and the addition of new restaurant locations. A key factor to our success in executing our expansion strategy will be our ability to retain our existing and future restaurant customers. Our exclusive, long-term, direct digital ordering contracts with our customers provide us the opportunity to form unique, trusted partnerships with our restaurant brands, further enhancing our ability to satisfy and retain our customers. Our average initial contract length is generally three years, providing visibility into our future performance. One indication of our ability to grow within our customer base through the development of our products that our customers value is our average revenue per unit, or ARPU. We calculate average revenue per unit by dividing the total platform revenue in a given period by the average active locations in that same period. We believe this demonstrates our ability to grow within our customer base through the development of our products that our customers value. The following summarizes our ARPU and number of active locations for the three months ended, or as of each of the dates presented. Three Months Ended September 30, 2021 2020 Average Revenue Per Unit $ 484 $ 450 Ending Active Locations 76,000 60,000 A further indication of the propensity of our customers to continue to work with and expand their relationship with us over time is our dollar-based net revenue retention rate, which compares our revenue from the same set of active customers in one period to the prior year period. We calculate dollar-based NRR as of a period-end by starting with the revenue, defined as platform revenue, from the cohort of all active customers as of 12 months prior to such period-end, or the prior period revenue. We then calculate the platform revenue from these same customers as of the current period-end, or the current period revenue. Current period revenue includes any expansion and is net of contraction or attrition over the last 12 months, but excludes platform revenue from new customers in the current period. We then divide the total current period revenue by the total prior period revenue to arrive at the point-in-time dollar-based net revenue retention. For the period ending September 30, 2021, we continued to maintain an NRR above 120%. While we have maintained this high NRR over the past three years, we are also seeing a trend where customers are purchasing all of our products at signing, which provides us with more platform revenue from the beginning of the arrangement, but leaves less room for expansion. Enable Higher Transaction Volume Transaction revenue will continue to be an important source of our growth. We intend to continue to work with our existing restaurant customers to enable higher transaction volume at their locations, which may enable us to generate additional subscription and transaction revenue. As on-demand commerce grows to represent a larger share of total off-premise food consumption, we expect to significantly benefit from this secular trend as we capture a portion of this increased on- demand commerce order volume. Not only does our software create the opportunity to drive more orders for our customers, but also we expect that the industry’s secular tailwinds will help increase transaction order volume as more consumers order food for off-premise consumption. As transaction volume increases, the subscription revenue we receive from our Ordering module may also increase as customers subscribe for higher tier ordering packages to enable more transactions. Additionally, as we continue 27
 Q3 2021 10Q Page 32 Page 34