
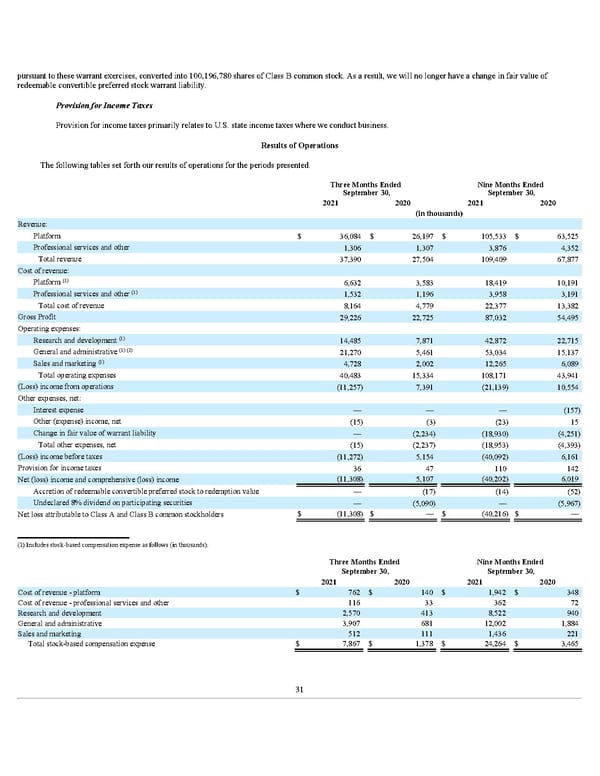
pursuant to these warrant exercises, converted into 100,196,780 shares of Class B common stock. As a result, we will no longer have a change in fair value of redeemable convertible preferred stock warrant liability. Provision for Income Taxes Provision for income taxes primarily relates to U.S. state income taxes where we conduct business. Results of Operations The following tables set forth our results of operations for the periods presented. Three Months Ended September 30, Nine Months Ended September 30, 2021 2020 2021 2020 (in thousands) Revenue: Platform $ 36,084 $ 26,197 $ 105,533 $ 63,525 Professional services and other 1,306 1,307 3,876 4,352 Total revenue 37,390 27,504 109,409 67,877 Cost of revenue: Platform 6,632 3,583 18,419 10,191 Professional services and other 1,532 1,196 3,958 3,191 Total cost of revenue 8,164 4,779 22,377 13,382 Gross Profit 29,226 22,725 87,032 54,495 Operating expenses: Research and development 14,485 7,871 42,872 22,715 General and administrative 21,270 5,461 53,034 15,137 Sales and marketing 4,728 2,002 12,265 6,089 Total operating expenses 40,483 15,334 108,171 43,941 (Loss) income from operations (11,257) 7,391 (21,139) 10,554 Other expenses, net: Interest expense — — — (157) Other (expense) income, net (15) (3) (23) 15 Change in fair value of warrant liability — (2,234) (18,930) (4,251) Total other expenses, net (15) (2,237) (18,953) (4,393) (Loss) income before taxes (11,272) 5,154 (40,092) 6,161 Provision for income taxes 36 47 110 142 Net (loss) income and comprehensive (loss) income (11,308) 5,107 (40,202) 6,019 Accretion of redeemable convertible preferred stock to redemption value — (17) (14) (52) Undeclared 8% dividend on participating securities — (5,090) — (5,967) Net loss attributable to Class A and Class B common stockholders $ (11,308) $ — $ (40,216) $ — Three Months Ended September 30, Nine Months Ended September 30, 2021 2020 2021 2020 Cost of revenue - platform $ 762 $ 140 $ 1,942 $ 348 Cost of revenue - professional services and other 116 33 362 72 Research and development 2,570 413 8,522 940 General and administrative 3,907 681 12,002 1,884 Sales and marketing 512 111 1,436 221 Total stock-based compensation expense $ 7,867 $ 1,378 $ 24,264 $ 3,465 (1) (1) (1) (1) (2) (1) (1) Includes stock-based compensation expense as follows (in thousands): 31
 Q3 2021 10Q Page 36 Page 38