
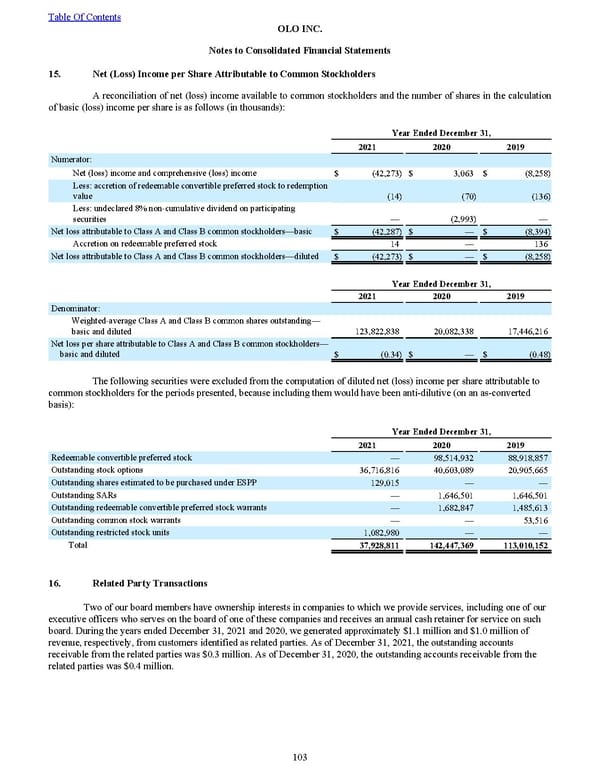
15. Net (Loss) Income per Share Attributable to Common Stockholders A reconciliation of net (loss) income available to common stockholders and the number of shares in the calculation of basic (loss) income per share is as follows (in thousands): Year Ended December 31, 2021 2020 2019 Numerator: Net (loss) income and comprehensive (loss) income $ (42,273) $ 3,063 $ (8,258) Less: accretion of redeemable convertible preferred stock to redemption value (14) (70) (136) Less: undeclared 8% non-cumulative dividend on participating securities — (2,993) — Net loss attributable to Class A and Class B common stockholders—basic $ (42,287) $ — $ (8,394) Accretion on redeemable preferred stock 14 — 136 Net loss attributable to Class A and Class B common stockholders—diluted $ (42,273) $ — $ (8,258) Year Ended December 31, 2021 2020 2019 Denominator: Weighted-average Class A and Class B common shares outstanding— basic and diluted 123,822,838 20,082,338 17,446,216 Net loss per share attributable to Class A and Class B common stockholders— basic and diluted $ (0.34) $ — $ (0.48) The following securities were excluded from the computation of diluted net (loss) income per share attributable to common stockholders for the periods presented, because including them would have been anti-dilutive (on an as-converted basis): Year Ended December 31, 2021 2020 2019 Redeemable convertible preferred stock — 98,514,932 88,918,857 Outstanding stock options 36,716,816 40,603,089 20,905,665 Outstanding shares estimated to be purchased under ESPP 129,015 — — Outstanding SARs — 1,646,501 1,646,501 Outstanding redeemable convertible preferred stock warrants — 1,682,847 1,485,613 Outstanding common stock warrants — — 53,516 Outstanding restricted stock units 1,082,980 — — Total 37,928,811 142,447,369 113,010,152 16. Related Party Transactions Two of our board members have ownership interests in companies to which we provide services, including one of our executive officers who serves on the board of one of these companies and receives an annual cash retainer for service on such board. During the years ended December 31, 2021 and 2020 , we generated approximately $1.1 million and $1.0 million of revenue, respectively, from customers identified as related parties. As of December 31, 2021 , the outstanding accounts receivable from the related parties was $0.3 million . As of December 31, 2020 , the outstanding accounts receivable from the related parties was $0.4 million . Table Of Contents OLO INC. Notes to Consolidated Financial Statements 103
 2022 10K Page 109 Page 111