
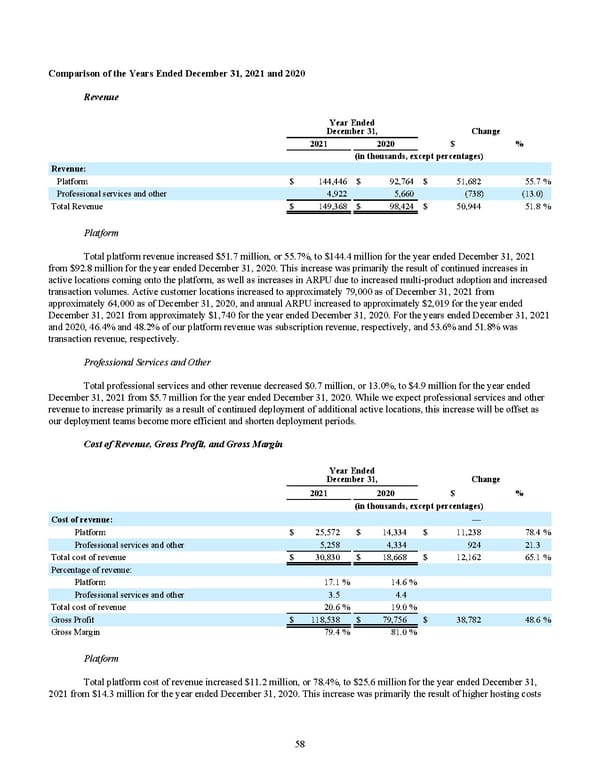
Comparison of the Years Ended December 31, 2021 and 2020 Revenue Year Ended December 31, Change 2021 2020 $ % (in thousands, except percentages) Revenue: Platform $ 144,446 $ 92,764 $ 51,682 55.7 % Professional services and other 4,922 5,660 (738) (13.0) Total Revenue $ 149,368 $ 98,424 $ 50,944 51.8 % Platform Total platform revenue increased $51.7 million , or 55.7% , to $144.4 million for the year ended December 31, 2021 from $92.8 million for the year ended December 31, 2020 . This increase was primarily the result of continued increases in active locations coming onto the platform, as well as increases in ARPU due to increased multi-product adoption and increased transaction volumes. Active customer locations increased to approximately 79,000 as of December 31, 2021 from approximately 64,000 as of December 31, 2020, and annual ARPU increased to approximately $2,019 for the year ended December 31, 2021 from approximately $1,740 for the year ended December 31, 2020 . For the years ended December 31, 2021 and 2020 , 46.4% and 48.2% of our platform revenue was subscription revenue, respectively, and 53.6% and 51.8% was transaction revenue, respectively. Professional Services and Other Total professional services and other revenue decreased $0.7 million , or 13.0% , to $4.9 million for the year ended December 31, 2021 from $5.7 million for the year ended December 31, 2020 . While we expect professional services and other revenue to increase primarily as a result of continued deployment of additional active locations, this increase will be offset as our deployment teams become more efficient and shorten deployment periods. Cost of Revenue, Gross Profit, and Gross Margin Year Ended December 31, Change 2021 2020 $ % (in thousands, except percentages) Cost of revenue: — Platform $ 25,572 $ 14,334 $ 11,238 78.4 % Professional services and other 5,258 4,334 924 21.3 Total cost of revenue $ 30,830 $ 18,668 $ 12,162 65.1 % Percentage of revenue: Platform 17.1 % 14.6 % Professional services and other 3.5 4.4 Total cost of revenue 20.6 % 19.0 % Gross Profit $ 118,538 $ 79,756 $ 38,782 48.6 % Gross Margin 79.4 % 81.0 % Platform Total platform cost of revenue increased $11.2 million , or 78.4% , to $25.6 million for the year ended December 31, 2021 from $14.3 million for the year ended December 31, 2020 . This increase was primarily the result of higher hosting costs 58
 2022 10K Page 64 Page 66