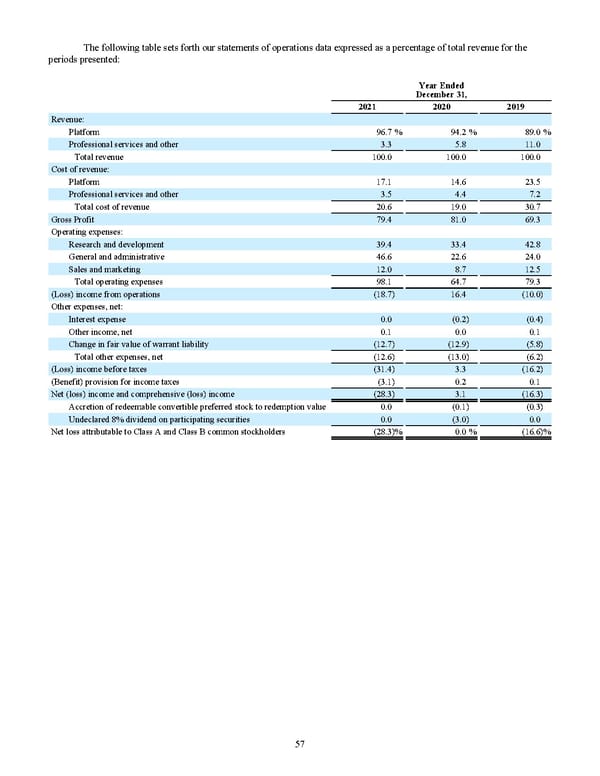
The following table sets forth our statements of operations data expressed as a percentage of total revenue for the periods presented: Year Ended December 31, 2021 2020 2019 Revenue: Platform 96.7 % 94.2 % 89.0 % Professional services and other 3.3 5.8 11.0 Total revenue 100.0 100.0 100.0 Cost of revenue: Platform 17.1 14.6 23.5 Professional services and other 3.5 4.4 7.2 Total cost of revenue 20.6 19.0 30.7 Gross Profit 79.4 81.0 69.3 Operating expenses: Research and development 39.4 33.4 42.8 General and administrative 46.6 22.6 24.0 Sales and marketing 12.0 8.7 12.5 Total operating expenses 98.1 64.7 79.3 (Loss) income from operations (18.7) 16.4 (10.0) Other expenses, net: Interest expense 0.0 (0.2) (0.4) Other income, net 0.1 0.0 0.1 Change in fair value of warrant liability (12.7) (12.9) (5.8) Total other expenses, net (12.6) (13.0) (6.2) (Loss) income before taxes (31.4) 3.3 (16.2) (Benefit) provision for income taxes (3.1) 0.2 0.1 Net (loss) income and comprehensive (loss) income (28.3) 3.1 (16.3) Accretion of redeemable convertible preferred stock to redemption value 0.0 (0.1) (0.3) Undeclared 8% dividend on participating securities 0.0 (3.0) 0.0 Net loss attributable to Class A and Class B common stockholders (28.3) % 0.0 % (16.6) % 57
 2022 10K Page 63 Page 65