
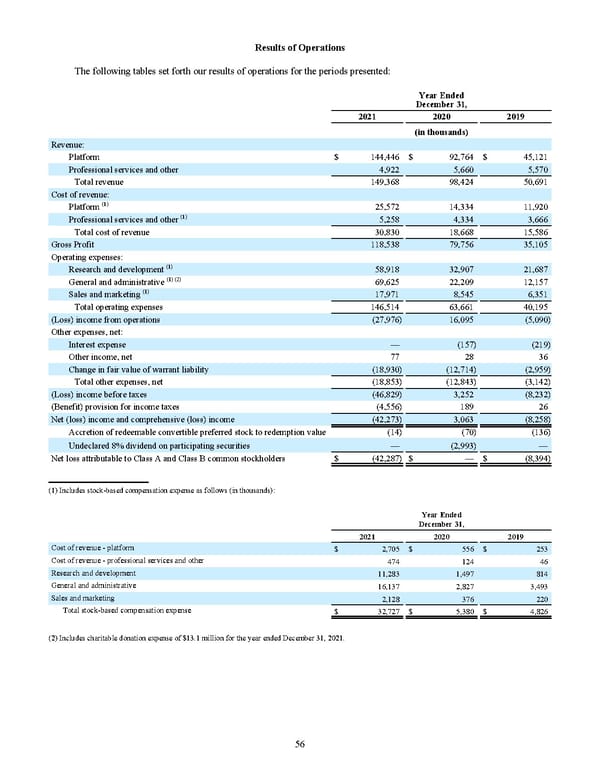
Results of Operations The following tables set forth our results of operations for the periods presented: Year Ended December 31, 2021 2020 2019 (in thousands) Revenue: Platform $ 144,446 $ 92,764 $ 45,121 Professional services and other 4,922 5,660 5,570 Total revenue 149,368 98,424 50,691 Cost of revenue: Platform (1) 25,572 14,334 11,920 Professional services and other (1) 5,258 4,334 3,666 Total cost of revenue 30,830 18,668 15,586 Gross Profit 118,538 79,756 35,105 Operating expenses: Research and development (1) 58,918 32,907 21,687 General and administrative (1) (2) 69,625 22,209 12,157 Sales and marketing (1) 17,971 8,545 6,351 Total operating expenses 146,514 63,661 40,195 (Loss) income from operations (27,976) 16,095 (5,090) Other expenses, net: Interest expense — (157) (219) Other income, net 77 28 36 Change in fair value of warrant liability (18,930) (12,714) (2,959) Total other expenses, net (18,853) (12,843) (3,142) (Loss) income before taxes (46,829) 3,252 (8,232) (Benefit) provision for income taxes (4,556) 189 26 Net (loss) income and comprehensive (loss) income (42,273) 3,063 (8,258) Accretion of redeemable convertible preferred stock to redemption value (14) (70) (136) Undeclared 8% dividend on participating securities — (2,993) — Net loss attributable to Class A and Class B common stockholders $ (42,287) $ — $ (8,394) (1) Includes stock-based compensation expense as follows (in thousands): Year Ended December 31, 2021 2020 2019 Cost of revenue - platform $ 2,705 $ 556 $ 253 Cost of revenue - professional services and other 474 124 46 Research and development 11,283 1,497 814 General and administrative 16,137 2,827 3,493 Sales and marketing 2,128 376 220 Total stock-based compensation expense $ 32,727 $ 5,380 $ 4,826 (2) Includes charitable donation expense of $13.1 million for the year ended December 31, 2021 . 56
 2022 10K Page 62 Page 64