
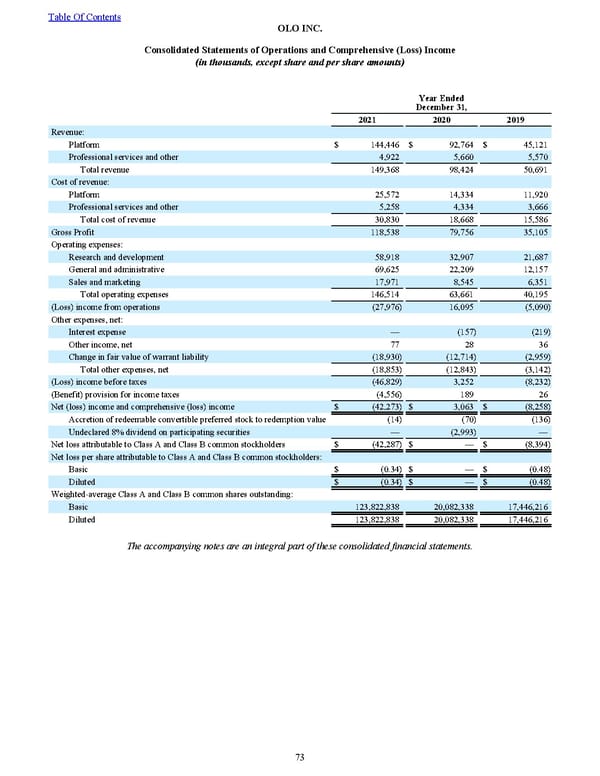
Year Ended December 31, 2021 2020 2019 Revenue: Platform $ 144,446 $ 92,764 $ 45,121 Professional services and other 4,922 5,660 5,570 Total revenue 149,368 98,424 50,691 Cost of revenue: Platform 25,572 14,334 11,920 Professional services and other 5,258 4,334 3,666 Total cost of revenue 30,830 18,668 15,586 Gross Profit 118,538 79,756 35,105 Operating expenses: Research and development 58,918 32,907 21,687 General and administrative 69,625 22,209 12,157 Sales and marketing 17,971 8,545 6,351 Total operating expenses 146,514 63,661 40,195 (Loss) income from operations (27,976) 16,095 (5,090) Other expenses, net: Interest expense — (157) (219) Other income, net 77 28 36 Change in fair value of warrant liability (18,930) (12,714) (2,959) Total other expenses, net (18,853) (12,843) (3,142) (Loss) income before taxes (46,829) 3,252 (8,232) (Benefit) provision for income taxes (4,556) 189 26 Net (loss) income and comprehensive (loss) income $ (42,273) $ 3,063 $ (8,258) Accretion of redeemable convertible preferred stock to redemption value (14) (70) (136) Undeclared 8% dividend on participating securities — (2,993) — Net loss attributable to Class A and Class B common stockholders $ (42,287) $ — $ (8,394) Net loss per share attributable to Class A and Class B common stockholders: Basic $ (0.34) $ — $ (0.48) Diluted $ (0.34) $ — $ (0.48) Weighted-average Class A and Class B common shares outstanding: Basic 123,822,838 20,082,338 17,446,216 Diluted 123,822,838 20,082,338 17,446,216 The accompanying notes are an integral part of these consolidated financial statements. Table Of Contents OLO INC. Con solidated Statements of Operations and Comprehensive ( Loss ) Income (in thousands, except share and per share amounts) 73
 2022 10K Page 79 Page 81