
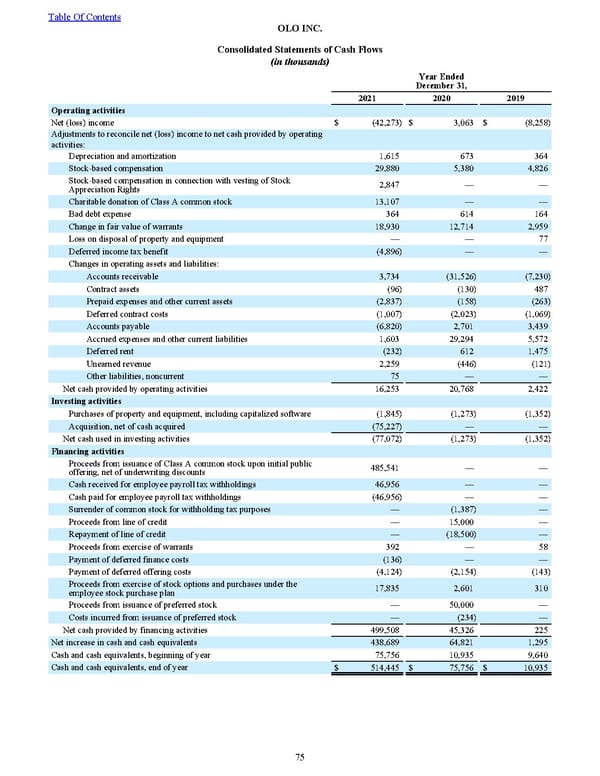
Year Ended December 31, 2021 2020 2019 Operating activities Net (loss) income $ (42,273) $ 3,063 $ (8,258) Adjustments to reconcile net (loss) income to net cash provided by operating activities: Depreciation and amortization 1,615 673 364 Stock-based compensation 29,880 5,380 4,826 Stock-based compensation in connection with vesting of Stock Appreciation Rights 2,847 — — Charitable donation of Class A common stock 13,107 — — Bad debt expense 364 614 164 Change in fair value of warrants 18,930 12,714 2,959 Loss on disposal of property and equipment — — 77 Deferred income tax benefit (4,896) — — Changes in operating assets and liabilities: Accounts receivable 3,734 (31,526) (7,230) Contract assets (96) (130) 487 Prepaid expenses and other current assets (2,837) (158) (263) Deferred contract costs (1,007) (2,023) (1,069) Accounts payable (6,820) 2,701 3,439 Accrued expenses and other current liabilities 1,603 29,294 5,572 Deferred rent (232) 612 1,475 Unearned revenue 2,259 (446) (121) Other liabilities, noncurrent 75 — — Net cash provided by operating activities 16,253 20,768 2,422 Investing activities Purchases of property and equipment, including capitalized software (1,845) (1,273) (1,352) Acquisition, net of cash acquired (75,227) — — Net cash used in investing activities (77,072) (1,273) (1,352) Financing activities Proceeds from issuance of Class A common stock upon initial public offering, net of underwriting discounts 485,541 — — Cash received for employee payroll tax withholdings 46,956 — — Cash paid for employee payroll tax withholdings (46,956) — — Surrender of common stock for withholding tax purposes — (1,387) — Proceeds from line of credit — 15,000 — Repayment of line of credit — (18,500) — Proceeds from exercise of warrants 392 — 58 Payment of deferred finance costs (136) — — Payment of deferred offering costs (4,124) (2,154) (143) Proceeds from exercise of stock options and purchases under the employee stock purchase plan 17,835 2,601 310 Proceeds from issuance of preferred stock — 50,000 — Costs incurred from issuance of preferred stock — (234) — Net cash provided by financing activities 499,508 45,326 225 Net increase in cash and cash equivalents 438,689 64,821 1,295 Cash and cash equivalents, beginning of year 75,756 10,935 9,640 Cash and cash equivalents, end of year $ 514,445 $ 75,756 $ 10,935 Table Of Contents OLO INC. Con solidated Statements of Cash Flows (in thousands) 75
 2022 10K Page 81 Page 83