
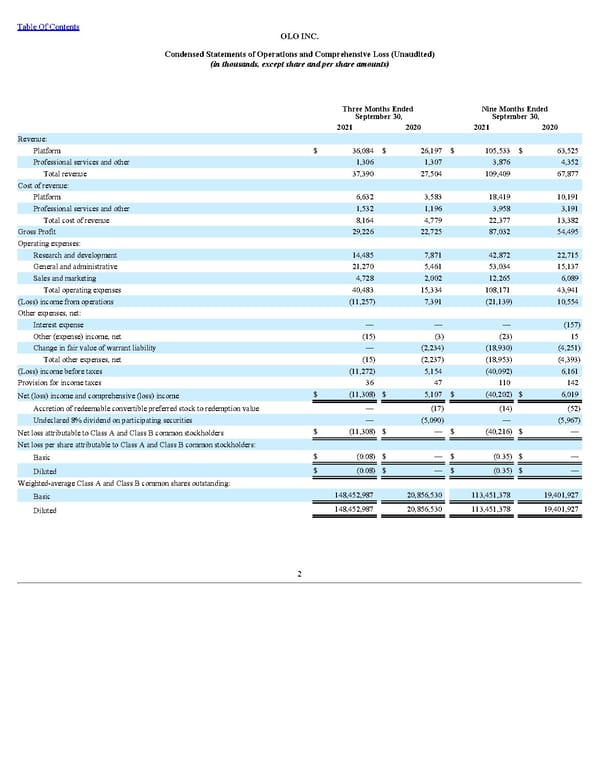
Table Of Contents OLO INC. Condensed Statements of Operations and Comprehensive Loss (Unaudited) (in thousands, except share and per share amounts) Three Months Ended September 30, Nine Months Ended September 30, 2021 2020 2021 2020 Revenue: Platform $ 36,084 $ 26,197 $ 105,533 $ 63,525 Professional services and other 1,306 1,307 3,876 4,352 Total revenue 37,390 27,504 109,409 67,877 Cost of revenue: Platform 6,632 3,583 18,419 10,191 Professional services and other 1,532 1,196 3,958 3,191 Total cost of revenue 8,164 4,779 22,377 13,382 Gross Profit 29,226 22,725 87,032 54,495 Operating expenses: Research and development 14,485 7,871 42,872 22,715 General and administrative 21,270 5,461 53,034 15,137 Sales and marketing 4,728 2,002 12,265 6,089 Total operating expenses 40,483 15,334 108,171 43,941 (Loss) income from operations (11,257) 7,391 (21,139) 10,554 Other expenses, net: Interest expense — — — (157) Other (expense) income, net (15) (3) (23) 15 Change in fair value of warrant liability — (2,234) (18,930) (4,251) Total other expenses, net (15) (2,237) (18,953) (4,393) (Loss) income before taxes (11,272) 5,154 (40,092) 6,161 Provision for income taxes 36 47 110 142 Net (loss) income and comprehensive (loss) income $ (11,308) $ 5,107 $ (40,202) $ 6,019 Accretion of redeemable convertible preferred stock to redemption value — (17) (14) (52) Undeclared 8% dividend on participating securities — (5,090) — (5,967) Net loss attributable to Class A and Class B common stockholders $ (11,308) $ — $ (40,216) $ — Net loss per share attributable to Class A and Class B common stockholders: Basic $ (0.08) $ — $ (0.35) $ — Diluted $ (0.08) $ — $ (0.35) $ — Weighted-average Class A and Class B common shares outstanding: Basic 148,452,987 20,856,530 113,451,378 19,401,927 Diluted 148,452,987 20,856,530 113,451,378 19,401,927 2
 Q3 2021 10Q Page 7 Page 9